Basically, Markbook90
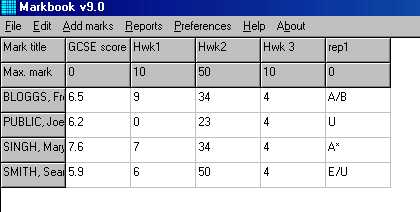
allows you to enter text information into a rectangular grid. The left column
has fixed content - the list of student names. The top two rows are also fixed;
the top row is the list of work item titles, and the second row contains the maximum
marks available for each work item. The other cells will normally be marks or
grades.
It is important to note that the grid is a grid of strings of text characters,
not numbers. Markbook90 stores the data exactly as it appears in the grid, i.e.
as text. You can therefore edit a markbook90 file in a text editor such as Notepad
or Wordpad, although this is not advisable since you could make alterations which
would be meaningless in the Markbook context. Markbook90 itself offers the editing
facilities you are likely to need, and will maintain the correct format.
The actual file format of a Markbook90 file (default extension .mbk, but you are
free to ignore this or set your own file extension) is as shown by the following
example:
4			First line = nst =number of students  (data rows)
5			Second line = nwk = number of work items  (data columns)
BLOGGS, Fred		Next nst lines = list of nst students
PUBLIC, Joe
SINGH, Mary
SMITH, Sean
GCSE score		Next (nst+2) lines = block of data for first work item (GCSE score)
0				(max mark, meaningless for GCSE score)
6.5				actual data
6.2
7.6
5.9
Hwk1			Next (nst+2) lines = block of data for second work item
10
9
0
7
6
Hwk2			And so on....
50
34
23
34
50
Hwk 3
10
4
4
4
4
rep1
0
A/B
U
A*
E/U
Note that the characters stored (the left column above - not the explanations!)
are exactly the text displayed in the grid.
The main form deals only with this text information, although there is some error
checking. For instance, if the work item name begins with the letters "rep"
for report, it is assumed that the data will be grades, and if invalid grades
are entered, a warning will be given.
The report generator processes the data, interpreting numerical text as numbers,
and working out the appropriate averages. You can enter any data into the cells,
but only columns consisting entirely of valid data (numerical column or grade
column) will be incorporated into a printed report. You may wish to store other
data, for your own use, but this will not be printed. There is one exception -
the single letter X in a cell denotes absence, and is considered as a valid entry,
but does not contribute to the calculation of an average.
Markbook90 takes each column, and checks it for valid data. If all cells are valid,
it works out the average (grades are given integral values of 0 for U, 1 for E/U,
2 for E up to 10 for A and 11 for A*). Students for whom no mark is available
(enter X) are not included in the average, but zero marks are included. Markbook90
then works out a position on a print line to place a * character, where the average
mark for that particular work item is arbitrarily given the standard position
shown in the examples in the introduction. The
scaling function used works best near the average. If the scaling function computes
a value outside the line limits, it prints the * at the end of the line. The scaling
function is not linear.
The grade bar printed below the data is again arbitrary - the default bar represents
the experience of the author over several years, but it can easily be modified
to suit individual teachers, using Preferences | Edit report preferences on the
main form.
The reports are printed using Nevrona's Rave Reports, an add-on to Borland Delphi-7
that was used to program Markbook90.